
The Catastrophe of Chernobyl: A Cartographic Examination
On April 26, 1986, reactor number 4 at the Chernobyl nuclear power plant exploded during a low-power safety test. This catastrophic event released about 400 times more radioactive material than the Hiroshima atomic bomb, according to the International Atomic Energy Agency.
The Impact of the Disaster
The RBMK-1000 reactor didn’t have a containment structure, allowing harmful radioisotopes such as iodine-131, cesium-137, and strontium-90 to disperse into the atmosphere for ten days until the graphite fire was extinguished on May 5. Evacuation orders for the nearby city of Pripyat were issued only 36 hours later, with initial radiation detection occurring in Sweden two days post-disaster.
Mapping the Aftermath
A decade later, independent Ukraine released the Atlas of the Chernobyl Exclusion Zone, compiling extensive cartographic resources that assess the radioactive impact of the disaster on soil, air, and ecosystems. Prominent experts, including many from the Ukrainian Academy of Sciences, contributed to this essential work.
Weather Maps: The Key to Understanding Dispersion
One of the first components of this atlas consists of weather maps of Europe during the active phase of the accident, illustrating atmospheric conditions. These maps are crucial for reconstructing how the radioactive cloud traveled, revealing the erratic trajectories influenced by weather fronts.
The maps indicated that countries like Sweden, Poland, and Austria received significant levels of radioactivity, even though they were farther from the epicenter, while regions closer to Chernobyl saw comparatively less contamination.
Daily synoptic weather maps of Europe during the active phase of the Chernobyl accident
Radiological Wind Rose and Asymmetrical Dispersion
The radiological wind rose presents mean wind directions in the atmospheric boundary layer, illustrating the extensive and uneven dispersion of radioactive materials. Some fronts pushed pollution towards Belarus and Scandinavia, while others deflected it south and west across Ukraine.
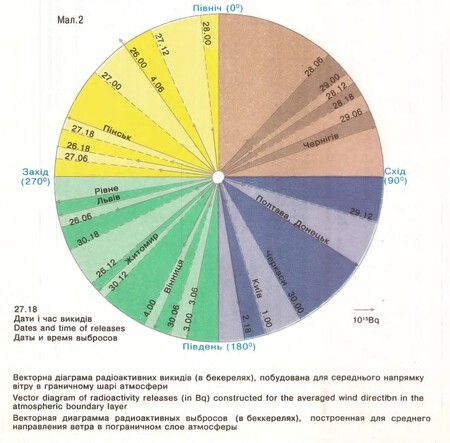
Vector diagram of radioactivity emissions (in Bq) based on average wind directions
The Most Informative Maps: Cesium-137 and Water Contamination
The Cesium-137 map is vital. Cesium-137 serves as a radiological tracer, directly showing contamination levels across significant areas. Its retrospective estimation, focused on May 10, 1986, illustrates a drastically asymmetrical contamination footprint.
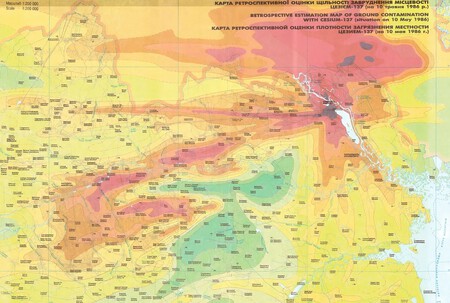
Retrospective estimation map of soil contamination with cesium-137.
In addition, the groundwater transport route map identifies long-term pollution risks. It tracks strontium-90’s migration through aquifers toward the Dnieper River, which supplies water to millions, reflecting a silent yet significant hazard.
Groundwater transport route map showing potential contaminant pathways
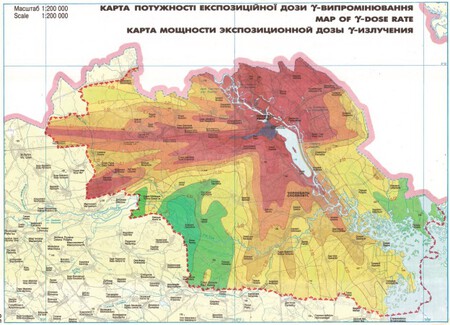
The Gamma Dose Rate Map
The gamma dose rate map illustrates the radiation levels measured one meter above the ground. Essential for making informed decisions about access to contaminated areas, it helped determine entry limitations for both the public and personnel involved in cleanup efforts.
Gamma dose map displaying radiation levels in μR/h
Conclusion
The mapping efforts following the Chernobyl disaster have played an invaluable role in understanding and mitigating the long-term effects of nuclear fallout. Through comprehensive cartographies, scientists and officials can make informed decisions regarding safety, health, and environmental management in affected areas.