
The Impact of Sea Level Rise on Our Future
Climate change has a consequence that is undoubtedly greatly feared by everyone: the sea level rise. Far from being a distant threat, its effects are already being felt around the world, and future projections force us to prepare for a scenario where our coasts will be altered. This alarming reality necessitates simulations to pinpoint which areas could be submerged beneath the waves.
Introducing the Sea Level Rise Viewer
To grasp the full magnitude of this challenge and visualize the affected areas, tools like the Sea Level Rise Viewer come into play. This 3D map , designed by Akihiko Kusanagi , allows us to peer into a daunting future. Unlike traditional 2D maps, this interactive simulation offers a photorealistic experience that is both engaging and unsettling.
This effective representation employs photorealistic 3D mosaics derived from Google Maps, alongside rendering technologies such as deck.gl and three.js. Such advanced technology enables users to witness firsthand the implications of climate change. Plus, the source code is open to the public, available for exploration on GitHub.
How the Simulator Works
The brilliance of the ‘Sea Level Rise 3D Map’ lies in its simplicity . Upon accessing the website, users encounter a 3D globe equipped with a straightforward interface. This interface foregrounds two critical elements:
- Sea Level: Users can visualize how coastal geography will transform as the sea level rises meter by meter. With each increase, blue layers of water engulf the terrain, initially submerging port areas and beaches before infiltrating urban centers. It’s vital to note that for every centimeter of sea level rise, the coastline retreats by 100 centimeters.
- Time of Day: This control allows users to change the time, adjusting lighting and shadows for a more realistic effect.
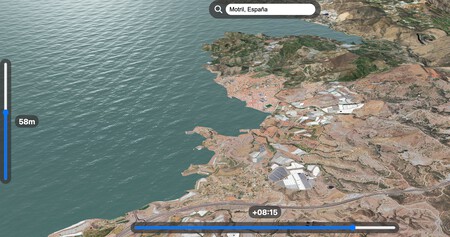
Simulation on the coasts of Motril (Granada) showing the impact of a 58 meter sea level rise.
The tool also features an excellent search engine at the top of the map. This functionality allows users to navigate to any city globally that is covered by Google’s 3D imagery. From iconic landmarks like the Statue of Liberty in New York to the Sagrada Familia in Barcelona or Big Ben in London, this tool provides a personalized view of a global crisis.
The Science Behind Sea Level Rise
While the tool serves as a visual demonstration rather than a predictive model, it vividly illustrates data that scientists have long warned us about in research papers and conferences. The rise in sea levels is primarily driven by two factors: thermal expansion due to the oceans absorbing over 90% of the heat generated by human emissions, and the melting of ice sheets in Greenland, Antarctica, along with mountain glaciers that release billions of tons of water into the oceans every year.
The Future: Few Solutions Exist
Even if immediate action were taken, the IPCC (Intergovernmental Panel on Climate Change) warns that global warming limits of even 1.5°C would still lead to inevitable sea level rise. Projections for 2100 suggest a potential increase ranging from about 43 cm in the most optimistic scenarios to exceeding 84 cm in the pessimistic ones.
This tool effectively shows how just a few meters of rising sea levels can illustrate the long-term challenges we face, emphasizing the urgency of addressing these issues and what we will leave behind for future generations.
Generating Awareness
Projects like the “Sea Level Rise 3D Map” are critical in today’s world. By converting abstract data into a visual, immersive experience, they accomplish what scientific reports often cannot: generating an emotional impact and instilling a sense of urgency within society.
Images | Chris Gallagher
In Xataka | What is a dana: how it forms, how it differs from a normal storm and how to act in one of them